HiGlass: A Multiscale Data Browser
HiGlass is a viewer for multi-scale data, originally designed to handle massive genomic data sets. HiGlass is built on a framework inspired by genome browsers and modern online maps (so-called slippy maps) to form a fast, extensible and responsive viewer for diverse types of multi-scale data.
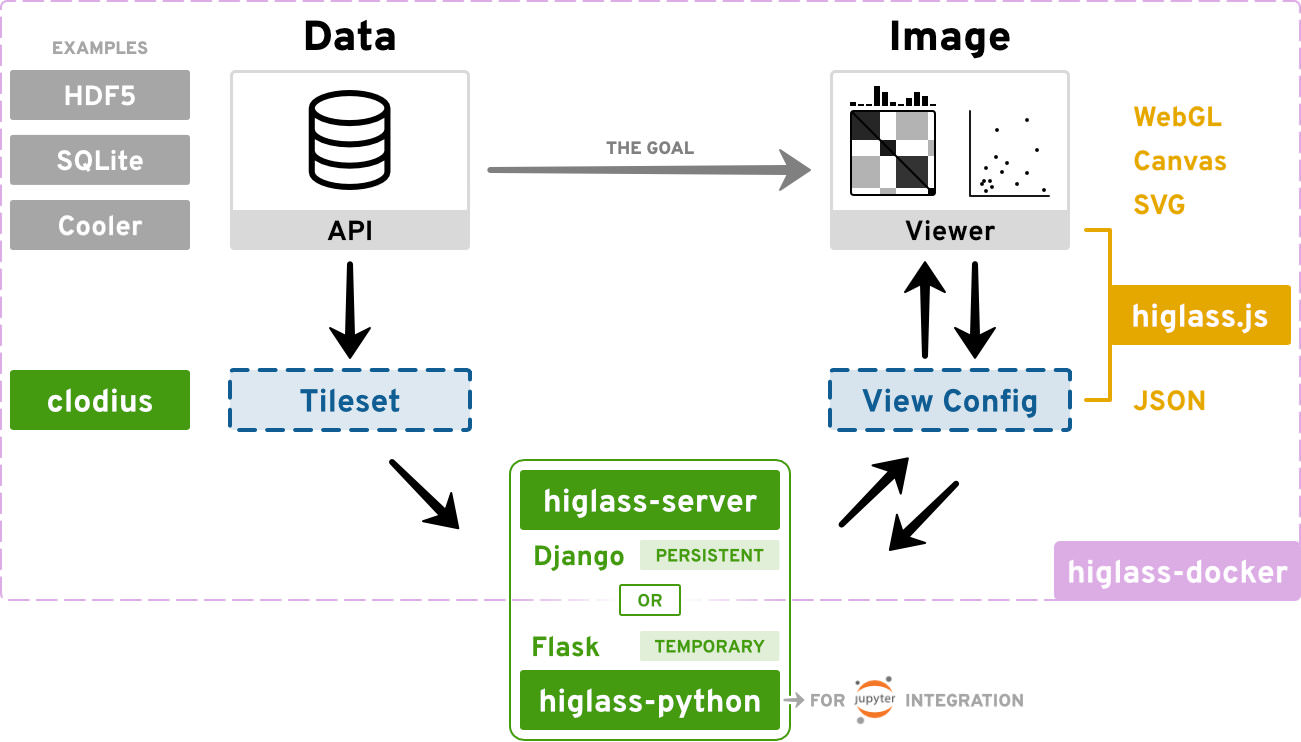
The HiGlass framework consists of several distinct components:
For an overview of HiGlass take a look atour talk from the SciPy conference 2019
higlass.js - This is the Javascript library that renders the tracks and provides the user interface. The vast majority of the updates are on this component.
higlass-server - The server manages and serves the data to the client in small chunks that match the current zoom level and location. It is a python django application that exposes an API. For example, http://higlass.io/api/v1/tilesets lists the tilesets that the server knows about.
clodius - This package implements the aggregation and tile generation logic for many common 1D and 2D data types.
higlass-python - This package contains directives to locally visualize data with HiGlass in Jupyter notebooks or Lab.
higlass-docker - Our docker container consists all packages that are required to run HiGlass as a persistent server to make the installation process easier. An update in any of the above repositories will be reflected in an update in the docker container. The versions of all the components is accessible at https://higlass.io/version.txt
Track types
HiGlass supports both 1D and 2D track types that can be arranged in views to show desired combinations of data.

Bed-like intervals

Gene annotations

Chromosome labels

Line

Point

Horizontal heatmap

Horizontal rectangle domains

Heatmap

Chromosome grid
It can be used to display a variety of track types populated with data from different file formats.
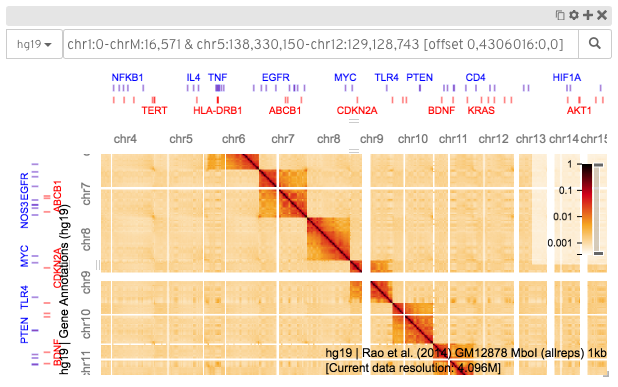
A screenshot of HiGlass displaying a Hi-C contact matrix along with tracks for gene annotations chromosome labels.
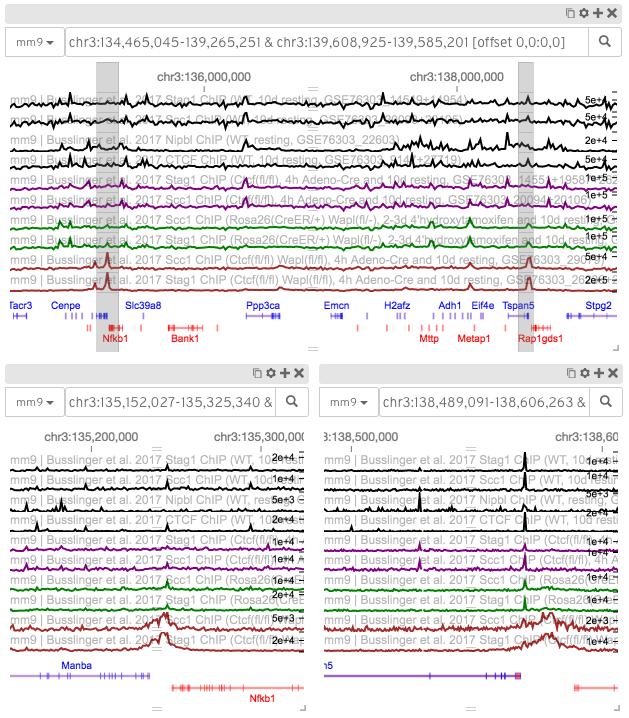
A screenshot of HiGlass displaying a context-detail type view of two regions of the mouse genome. The locations of the two detail regions on the bottom are highlighted in the context view on top.
Technology
HiGlass is built with a variety of different open source components. The most crucial are listed below.
- D3.js - an outstanding library for online data visualization. We make heavy use of D3’s scales, zoom behavior and brush behavior.
- Pixi.js - a fast, easy to use and most importantly, well-documented library for drawing scene graphs on html canvases. Oh, and it has WebGL support. We use Pixi to quickly render track data and perform updates on zooming and panning.
- React - a widely used library for managing state within web applications. We use React to manage the user-interface components and lay out the positions of the views and tracks.