Track Types
Linking value scales
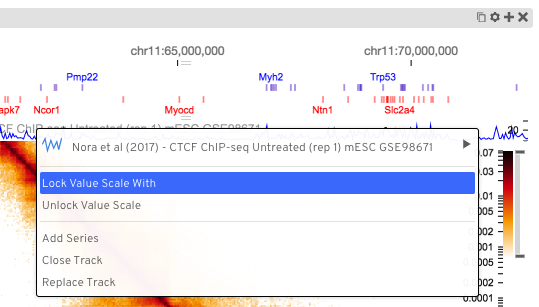
The scaling of values in quantitative tracks is done from lowest to highest values. Two tracks displaying different data will likely have different axis scales based on the extent of the data visible in each. To enable comparison between the two tracks, HiGlass supports locking value scales such that they both display the same axes. This can be done using the track configuration menu:
Bed-like

track-type: bedlike
datatype: bedlike
The bedlike track is intended to display generic interval data. It is used to render tracks with a bedlike datatype. This usually comes from the beddb filetype. Regular bed-like files can be converted to beddb using the instructions in the data preparation section.
This track has two modes: stranded and unstranded (value-based). In stranded mode, which is activated when the underlying data has information about which strand entries are on, items on the + and - strand are drawn above each other. Overlapping items are further stacked.
In unstranded (value-based) mode, items can be be ordered vertically or colored based on the values of a column (chosen in the config -> “Value column” section).
Color Encoding:
Intervals can visually encode information using the following three options:
- colorEncoding: int, null or “itemRgb”
- If set to a bed column number (1-based), use the values in that column to color the annotations. If set to itemRgb, then check if the underlying BED file has a 9th column and use the r,g,b value there to color the annotations. (default: “itemRgb”)
- colorRange: array of color values
- A list of colors that make up the continuous color map. Defaults to the same colormap used by the heatmap track.
- colorEncodingRange: [Number, Number]
- A tuple defining the minimum and maximum range value for color encoding. Defaults to the min and max values.
- fillColor:
- Fill color if annotations aren’t stranded (default “blue”)
- fillOpacity:
- The opacity of the annotations.
- fontColor:
- The color of the label text’s font
- fontSize:
- The font size for annotation labels (default 10)
- maxAnnotationHeight: int or null
- The maximum annotation height when using ‘scaled’ annotation heights. Useful to avoid huge annotations. (default ‘none’)
- maxTexts
- Limit the maximum number of texts that can be shown (default: 50)
- minusStrandColor
- For stranded mode, the color of the minus strand entries. Ignored if
colorEncodingis set. (default “purple”)
- plusStrandColor
- For stranded mode, the color of the plus strand entries. Ignored if
colorEncodingis set. (default “blue”)
- separatePlusMinusStrands
- Draw + and - strand annotations at different y values if true. Draw them at the same vertical position if false. (default: true). This option only takes effect if the valueColumn is set to null. Otherwise annotations are placed along the y-axis according to the values in their valueColumn.
- showTexts: ‘yes’ or ‘no’
- Show annotation labels? (default: no)
- valueColumn: int or null
- Use one of the bed columns (1-based) to scale the annotations along the y axis. (default null)
Here is an example snippet. Used if the other options aren’t set.
{
  ...,
  colorEncoding: true,  // Turn on color encoding
  colorRange: [  // Define the color map
    '#000000', '#652537', '#bf5458', '#fba273', '#ffffe0'
  ],
  colorEncodingRange: [0, 0.5119949],  // Limit the encoding range
  ...
}
Other Options*
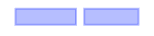
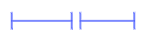
- annotationStyle: [box|segment]
Two different ways of displaying annotations. Box style as pictured on the right top and segment style as shown on the right bottom. Box style is the default.
Empty
track-type: empty
The empty track can be used to create blank space between other tracks. It can be placed in either the left, right, top or bottom positions.
Gene Annotations

track-type: gene-annotations
datatype: gene-annotation
Gene annotations display the locations of genes and their exons and introns. The tracks displayed on HiGlass show a transcript consisting of the union of all annotated exons in refseq. There are separate tracks for the different available species. Details on how gene annotation tracks are created is available in the gene annotations section.
Event Handlers
- click: Called when a gene annotaion is clicked on. The parameter to the callback is a single object whose format is described below. Genome coordinates are offsets from position 0 as if the chromosomes were laid out end-to-end.
{
  type: "gene-annotation",
  event: [PIXI.js event object],
  payload: {
    xStart: [int: genome coordinate ],
    xStart: [int: genome coordinate ],
    offset: [int: start of this annotations chromosome (genome coordinate)],
    uid: [string: unique identifier for this annotation],
    fields: [array: genePred formatted array of values],
    ... other fields
  }
}
Heatmap

track-type: heatmap
datatype: matrix
Heatmaps in HiGlass are usually used to display HiC data. They log-scale input values and map them to a user-selectable color scale (color map configuration option). Because HiGlass displays data at varying zoom levels, heatmaps are displayed at different resolutions depending on the current zoom level. To limit the resolution of the displayed data, users can set the Zoom Limit configuration option.
You can limit the extent of the heatmap to the upper right and lower left
triangle via the track context menu or by setting extent option to
upper-right or lower-left respectively.
Options
- colorRange: This is an array of colors used to create a segmented color
scale for the heatmap. The contents of this array are passed in to d3’s scaleLinear function to create the color scale. The domain of the color scale spans the lowest visible value to the highest visible value except when modified by the colorbar. Acceptable color values are ones that can be used with CSS (see, for example, Color Names ). Example:
"colorRange": [
  "white",
  "rgba(245,166,35,1.0)",
  "rgba(208,2,27,1.0)",
  "black"
]
- valueScaleMin/valueScaleMax: Absolute values limiting the value to color scale. The scale can be further adjusted within
this range using the colorbar.
- zeroValueColor: The color to use for zero data values. By default, null, which uses the current color scale. (NaN values are not assigned any color)
Rotated 2D Heatmap

track-type: linear-heatmap
datatype: matrix
Rotated 2D heatmaps are regular 2D heatmaps sliced across the diagonal and rotated 45 degrees. The base of the heatmap is always the diagonal of the 2D heatmap. This is useful for displaying data, such as HiC, which has prominent features along the diagonal.
2D Rectangle Domain

track-type: 2d-rectangle-domains
The rectangle domains track shows rectangular regions on the heatmap. These are
commonly aggregated using clodius based on some importance using the clodius
bedpe command. See the data preparation section for an example of the aggregation
command.
Options
flipDiagonal: [yes|no|copy]- If yes, flip domains across the diagonal. If no, plot as usual. If copy, plot regular and mirrored.
Importing
higlass-manage ingest --filetype bed2ddb --datatype 2d-rectangle-domains annotations.bed2ddb
Linear 2D Rectangle Domain

track-type: linear-2d-rectangle-domains
datatype: 2d-rectangle-domains
Horizontal rectangle domains show a 45 degree rotation of rectangular domains on a 1D track. This track is most commonly used with domains that are close to the diagonal of the heatmap. Because the track is oriented so that the diagonal of the 2D view is situated along its base, rectangles far from the diagonal may be outside of the bounds of the track.
Line

track-type: line
datatype: vector
Line tracks display 1D vector data. Because each line segment requires two adjacent points to be present, data with lots of NaNs may lead to a fragmented plot. For such data, the bar track or point track may be more appropriate.
Options
- axisLabelFormatting: [‘normal’, ‘scientific’] - Display the vertical axis labels as regular numbers or using scientific notation.
- lineStrokeColor: - A valid color (e.g.
black) or to track the color of the line use[glyph-color]. - constIndicators: Array of constant value indicators - A constant value indicator display a line for a constant value, e.g., a minimum or maximum value. This property is also available on other 1D tracks like
BarandPointtracks. See the following for an example:
{
  type: 'line',
  ...
  options: {
    constIndicators: [
      {
        color: '#000000',
        opacity: 0.33,
        label: 'Max',
        labelPosition: 'leftBottom',
        labelColor: '#000000',
        labelOpacity: 0.25,
        value: 60000
      },
    ],
    ...
  }
}
- valueScaleMin/valueScaleMax: Absolute values limiting the the value scale, which is used to determine y-position (in 1D tracks) or color (heatmap) tracks.
Bar

track-type: bar
datatype: vector
Bar tracks display 1D vector data as bars.
Options
- axisLabelFormatting: [‘normal’, ‘scientific’] - Display the vertical axis labels as regular numbers or using scientific notation.
- barFillColor: A valid color (e.g.
black) or to track the color of the bars use[glyph-color]. - valueScaleMin/valueScaleMax: Absolute values limiting the value to y-position scale.
- zeroLineVisible: If
truedraws a demarcation line at the bottom of a bar track, i.e., at the zero value. - zeroLineColor: The color of the zero line. If
undefinedthe bar fill color (barFillColor) will be used. - zeroLineOpacity: The opacity of the zero line. If
undefinedthe bar opacity (barOpacity) will be used.
Demos:
- Diverging bars with color map and gradient <examples/bar-track-color-range.html>
Point

track-type: point
datatype: vector
Point tracks display 1D vector data. Unlike line tracks, they are well suited to data with NaNs because they do not require two points to draw something.
Options
- axisLabelFormatting: [‘normal’, ‘scientific’] - Display the vertical axis labels as regular numbers or using scientific notation.
- valueScaleMin/valueScaleMax: Absolute values limiting the value to y-position scale.
1D Heatmap
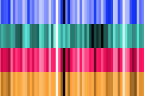
track-type: 1d-heatmap
datatype: vector
1D heatmap tracks display 1D vector data. Unlike the other 1D tracks, they are well suited for getting an overview of distribution and less suited for identifying precise properties of individual data points. E.g., finding regions that are on average highly expressed is much easier than finding the highest peak with this track.
Example:
{
  server: 'http://higlass.io/api/v1',
  tilesetUid: 'e0DYtZBSTqiMLHoaimsSpg',
  uid: '1d-heatmap',
  type: '1d-heatmap',
  options: {
    labelPosition: 'hidden',
    colorRange: ['#FFFFFF', '#ccc6ff', '#4f3de5', '#120489', '#000000'],
  },
  height: 12,
}
Demo:
Options
- valueScaleMin/valueScaleMax: Absolute values limiting the value to color scale. The scale can be further adjusted within
this range using the colorbar.
Chromosome Labels

track-type: chromosome-labes
datatype: chromsizes or cooler
filetypes: chromsizes-tsv
The chromosome labels track shows the names of the chromosomes. Its data is sourced from a standard chromSizes file containing chromosome names and chromosome files. The file can be ingested by the higlass server like any other tileset. As long as the datatype is set to chromsizes this track should be selectable from the “Add Track Dialog”.
Options
- tickPositions: [even|ends] Space tick marks evenly across the track or only show them at the start and end.
- tickFormat: [plain|si] The format for the ticks. If set to plain, ticks are formatted as regular numbers with commas delimiting blocks of zeros (e.g. 1,100,000). If set to SI, then SI prefixes along with precision limiting is used (e.g. 1.1M). If not specified, the default is plain for
tickPosition == 'even'and si fortickPosition == 'ends' - reverseOrientation: [false|true] Alignment of ticks. If set to true, ticks stick to the top in the horizontal label tracks and to the left in the vertical label tracks.
Demos:
Chromosome Grid

track-type: 2d-chromosome-grid
datatype: chromsizes or cooler
filetypes: chromsizes-tsv
A chromosome grid displays the boundaries of chromosomes on the 2D area. Its data is sourced from a standard chromSizes file containing chromosome names and chromosome files. The file can be ingested by the higlass server like any other tileset. As long as the datatype is set to chromsizes this track should be selectable from the “Add Track Dialog”.
To find the chromosome grid in the list of tracks, search for “chromosomes” when adding a track to the center view.
Horizontal Chromosome Grid

track-type: chromosome-labels
datatype: chromsizes or cooler
filetypes: chromsizes-tsv
The horizontal chromosome grid shows the locations of chromosome boundaries on a 1D track.
Stacked Bars

track-type: stacked-bar
datatype: multivec
Stacked bar tracks display multivec data. They show multiple values at every location in the data by using a set of vertically stacked bars. There is an option to pick ‘unscaled’ and ‘scaled’ representations, which scale the height of the bars to the maximum and minimum value in all visible tiles or to fit the height of the track, respectively.
Multiple Lines

track-type: basic-multiple-line-chart
datatype: multivec
Displays multivec data by showing multiple values at every location using a number of line graphs.
Multiple Bar Charts

track-type: basic-multiple-bar-chart
datatype: multivec
Displays multivec data by showing multiple values at every location using a number of bar graphs.
1D Annotations

track-type: 1d-annotations and 1d-annotations
datatype: none
Displays absolute positioned 1D annotations on horizontal and vertical 1D tracks
as well as 2D tracks. This track can be used to permanently highlight 1D regions
in any kind of dataset. The data is directly passed in via the regions
parameter of the options.
Example:
{
  uid: 'selection-a',
  type: '1d-annotations',
  options: {
    regions: [
      [230000000, 561000000],
    ],
    minRectWidth: 3,
    fillOpacity: 0.1,
    stroke: 'blue',
    strokePos: ['left', 'right'],
    strokeWidth: 2,
    strokeOpacity: 0.6,
  }
}
Multivec

track-type: multivec
datatype: multivec
Multivec tracks show multiple values at every location in the data by using a set of rows.
Options
- colorbarPosition: [‘hidden’, ‘topLeft’, ‘topRight’, ‘bottomLeft’, ‘bottomRight’] - The position of the colorbar element.
- colorbarBackgroundColor: The background color for the colorbar element.
- zeroValueColor: The color to use for zero data values. By default, null, which uses the current color scale.
- selectRows: Array of row indices (of the original multivec dataset) to include in the visualization. This enables filtering, sorting, and aggregation. By default, null, to show all rows and use the default ordering.
- selectRowsAggregationMode: If the
selectRowsarray contains subarrays, these will be treated as aggregation groups. This option can be used to define the aggregation function to use (“mean”, “sum”, “variance”, “deviation”). By default, “mean”. - selectRowsAggregationWithRelativeHeight: If the
selectRowsarray contains subarrays, this option will determine whether the visual heights for the aggregated row groups will be scaled by the group size or always a single unit. By default, true. - selectRowsAggregationMethod: Where should the aggregation be done? By default, “client”.
Example:
{
  type: 'multivec',
  uid: 'K_0GxgCvQfCHM56neOnHKg',
  tilesetUid: 'abohuD-sTbiyAPqh2y5OpA',
  server: 'https://resgen.io/api/v1',
  options: {
    labelPosition: 'topLeft',
    labelColor: 'black',
    labelTextOpacity: 0.4,
    valueScaling: 'linear',
    trackBorderWidth: 0,
    trackBorderColor: 'black',
    heatmapValueScaling: 'log',
    name: 'my_file_genome_wide_20180228.multires.mv5',
    labelLeftMargin: 0,
    labelRightMargin: 0,
    labelTopMargin: 0,
    labelBottomMargin: 0,
    labelShowResolution: true,
    minHeight: 100,
    colorbarPosition: 'topRight',
    colorbarBackgroundColor: '#ffffff'
  },
  width: 1500,
  height: 700
}
Viewport Projection
track-type: viewport-projection-horizontal, viewport-projection-vertical, viewport-projection-center
Viewport projection tracks allow brushing interactions for an interval or area, which is optionally linked to the domain of another view.
Properties
- fromViewUid: The
uidof the linked view, from which this track will obtain its domain. If null, then theprojectionXDomainand/orprojectionYDomainproperties must be used instead. - projectionXDomain:
[x0, x1]The x domain coordinates that define the selected interval. Only used iffromViewUidis null. - projectionYDomain:
[y0, y1]The y domain coordinates that define the selected interval. Only used iffromViewUidis null.
Options
- projectionFillColor: The fill color for the brush selection rect element.
- projectionStrokeColor: The stroke color for the brush selection rect element.
- projectionFillOpacity: The opacity for the fill of the brush selection rect element.
- projectionStrokeOpacity: The opacity for the stroke of the brush selection rect element.
- strokeWidth: The stroke width for the brush selection rect element.
Example:
{
  "type": "viewport-projection-horizontal",
  "uid": "my-track-id",
  "fromViewUid": null,
  "projectionXDomain": [225681609.97037065, 226375261.90599522],
  "options": {
    "projectionFillColor": "#F00",
    "projectionStrokeColor": "#777",
    "projectionFillOpacity": 0.3,
    "projectionStrokeOpacity": 0.7,
    "strokeWidth": 1
  }
}